Keeping you informed
Our View Outage map provides outage and restoration information to customers. To view our map, you can visit visit our website and select your location to view outages in your area or download the Entergy mobile app. When a major storm is not impacting our service area, use the information below to navigate our map.
During major storms, a large amount of activity is taking place in the field to restore power as safely and quickly as possible. In these cases, we shift our map into storm mode to provide you the latest restoration information as it is available.
Navigating the map
Icons at the top of the menu to the left can be used for quick navigation. You can easily switch between views, search for locations by county/parish or state or access stored "favorite" views. To close the menu for a fuller view of our outage map, select the return arrow at the top right of the menu.
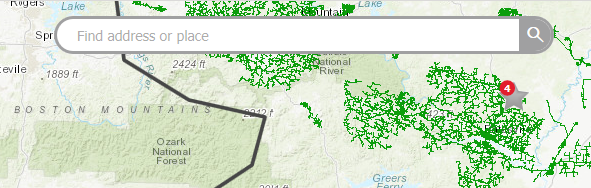
Find your address
Finding your address is easier than ever. The field where you enter your address is located prominently on the map itself for ease of use.
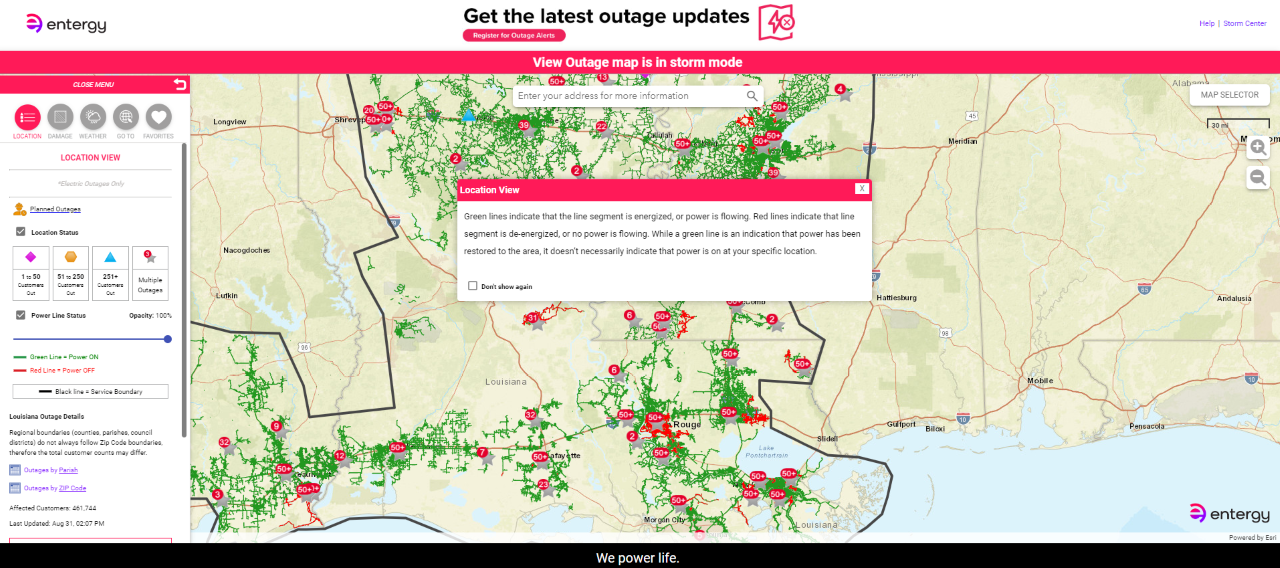
Location view
The location view shows red and green lines and icons indicating outages on Entergy’s system. The opacity slider allows you to change the brightness of these lines as desired.
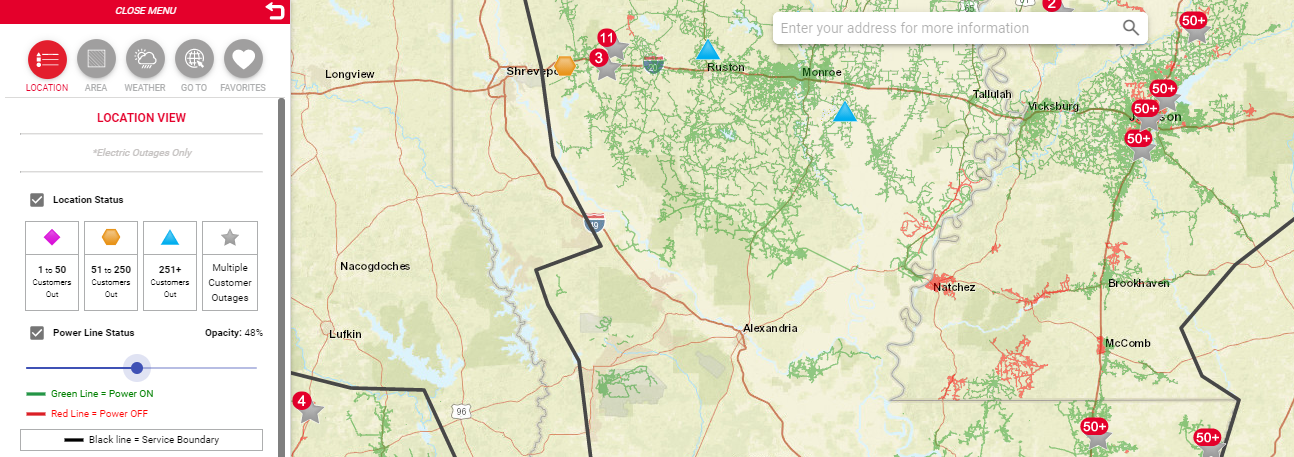
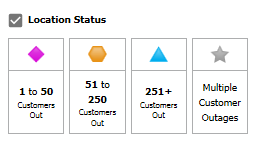
Green lines indicate that the line segment is energized, or power is flowing. Red lines indicate that line segment is de-energized, or no power is flowing. A green line is an indication that power has been restored to the area; it doesn’t necessarily indicate that power is on at your specific location. Icons for power outages are based on the number of customers impacted. You can select any of these icons for outage details.
When power outages are present, a number near the star icon will indicate the number of separate outages in the area. Just select the icon for a “zoom in” option that provides a more detailed view of the map.
Restoration times are only estimates. Indication that power is restored to your area does not guarantee your house/business has power. We cannot restore power to structures with damaged electrical equipment.
The line that marks Entergy’s service area is black for better visibility.
Please stay away from downed power lines. Energized power lines may not be visible among the damage after a storm. Report downed lines immediately to Entergy at 1-800-9OUTAGE (1-800-968-8243).
Weather
This view provides an overlay of real-time weather radar information for you to see weather as it’s impacting your area. The opacity slider allows you to change the brightness of these lines as desired.
Go To
This section allows you to quickly navigate to different parts of our map. With this section, you can go to your location, a specific parish or county or switch views to a different state.
Favorites
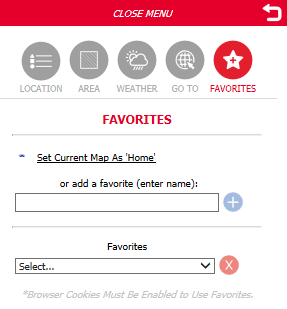
Customize the map with your favorite locations. Save multiple locations so you can quickly navigate to a specific service address to view power status.
How to use our View Outage map in storm mode
When we experience significant outages in our service area or if we are anticipating outages due to a major storm, we’ll shift our View Outage map into storm mode. Due to the dynamic nature of restoration response, customers can anticipate delays in outage restoration information through our map and outage notifications. During this time, crews continue safely working to accurately assess damage, and we’re committed to providing customers with the latest outage restoration information.
Customers are encouraged to report their outage through our quick and easy digital options including our free mobile app, online at myEntergy.com, or by texting OUT to 36778. An outage can also be reported by calling 1-800-9OUTAGE, but there may be a delay due to the volume of calls typically received during storm restoration. If calling our contact center or reaching out to us via social media, please know our agents will have the same information about your power status that’s available on our View Outage map.
To ensure customers receive accurate information, we may disable automated outage notifications. In that case, customers should not expect to receive accurate status updates of their power outage by texting STAT to 36778.
Below are layers you may see when we transition to storm mode on our View Outage map.
Location view
During a storm with significant outages, the map icons providing outage details may not reflect the latest information. Customers will continue to see red and green lines indicating whether a line segment is energized, or power is flowing to that line. Please note, this is not an indication of power flow to a customer’s home, as there may be equipment damage on a customer’s property that they’ll need to repair. Find out what steps to take to repair your equipment.
As we have information, including damage assessment progress and estimated restoration times, we'll update customers through the View Outage map. During the peak of our restoration efforts, updates will be provided at least twice a day on the alert message at the top of the web page.
Pre-storm view
When a major storm is threatening our service area, the map may also feature a pre-storm layer to provide weather, damage and estimated restoration predictions based on historical experience. In the pre-storm view, the map displays weather impact with weather data updated every half hour.
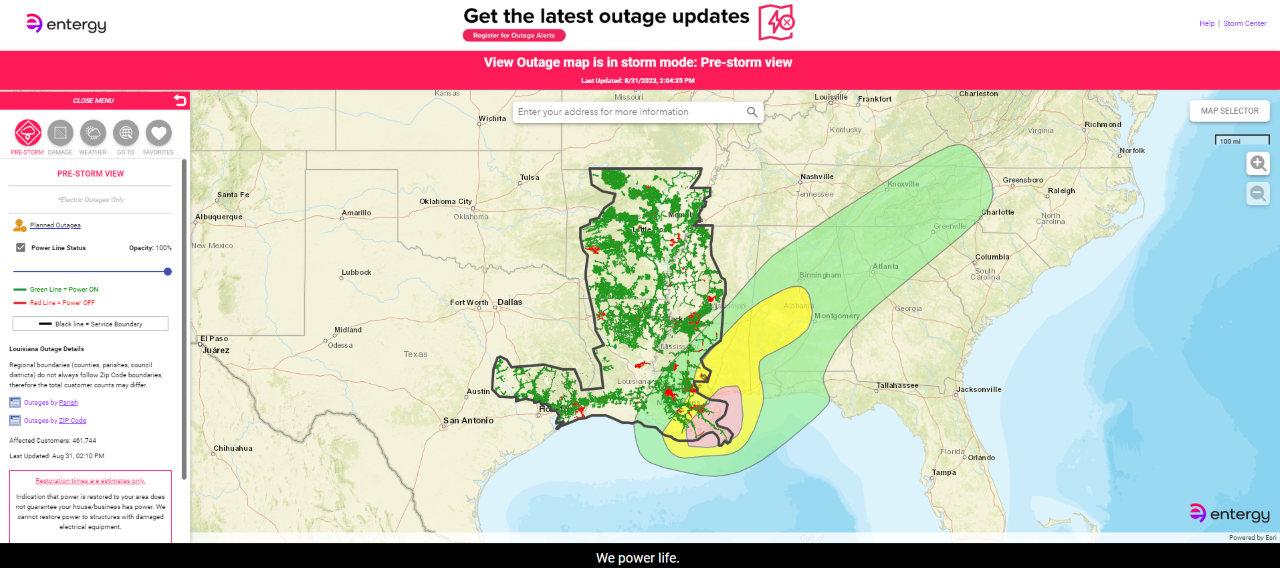
There are three distinct color-coded bands – red, yellow and green – that indicate the potential impact of an impending storm. Selecting any of the bands or a specific address within a band will open a pop-up window with 1) observed and forecasted weather, 2) damage predictions and 3) estimated restoration timelines.
- Green represents the least severe weather forecast where light infrastructure damage is expected. So, the fastest restoration time should be expected.
- Yellow represents moderately severe weather forecasted where moderate infrastructure damage is expected. So, the average restoration time should be expected.
- Red represents the most severe weather forecast where severe infrastructure damage is expected. In these areas, the extended restoration time would be necessary. Note: The number of days required to restore depends on storm category, so it can’t be stated here generically. We’ll share the estimated restoration timeline once we know definitively the category of storm.
When sever winter weather is threatening our service area, there are pink and blue color bands indicating the potential impact of an impending winter weather storm. Clicking on any of the bands or a specific address within a band will provide a pop-up window with 1) observed and forecasted weather, 2) damage predictions, and 3) estimated restoration, if available.

Damage assessment view
After the storm passes, the map will display the damage assessment view. This view shows the number of customers experiencing outages by county or parish and provides detailed damage assessment information as it becomes available.
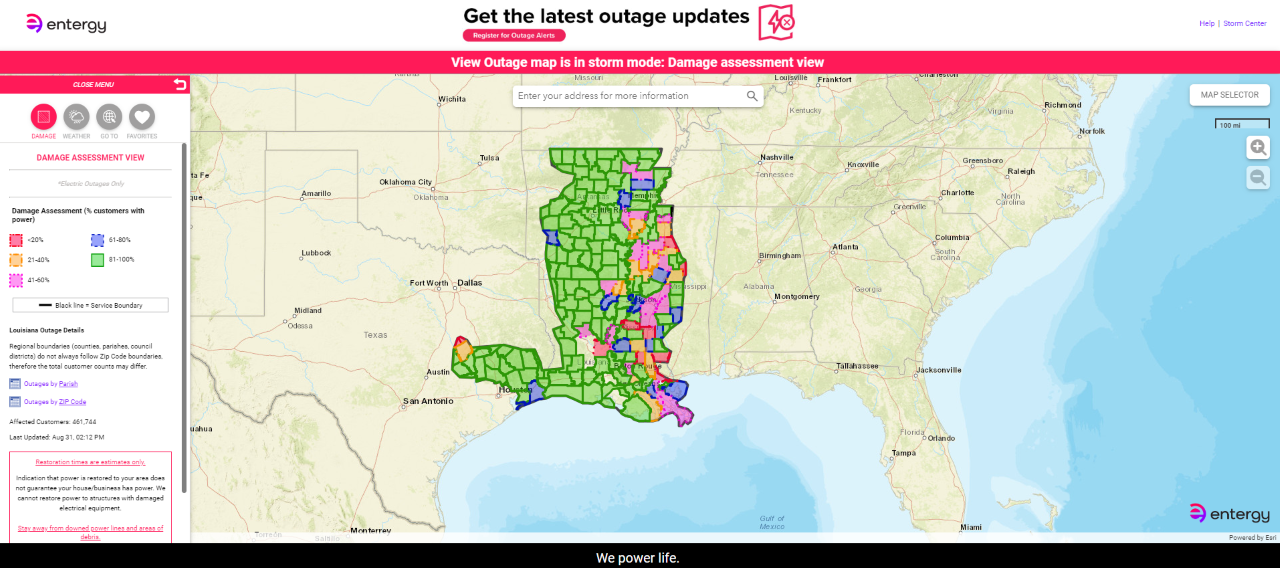
To find location specific information, customers may enter their zip code or service address into the search field or hover over their outlined area on the map.
A pop-up window will display with information specific to the entered geographic area.
We expect the damage assessment view to remain active for approximately three days as work in the field progresses. Power is restored in parallel with assessments where possible.
Estimated restoration time view
As the majority of damage assessments are complete, and our crews have a better idea of actual damage caused by the storm, the map will display the estimated restoration time view.
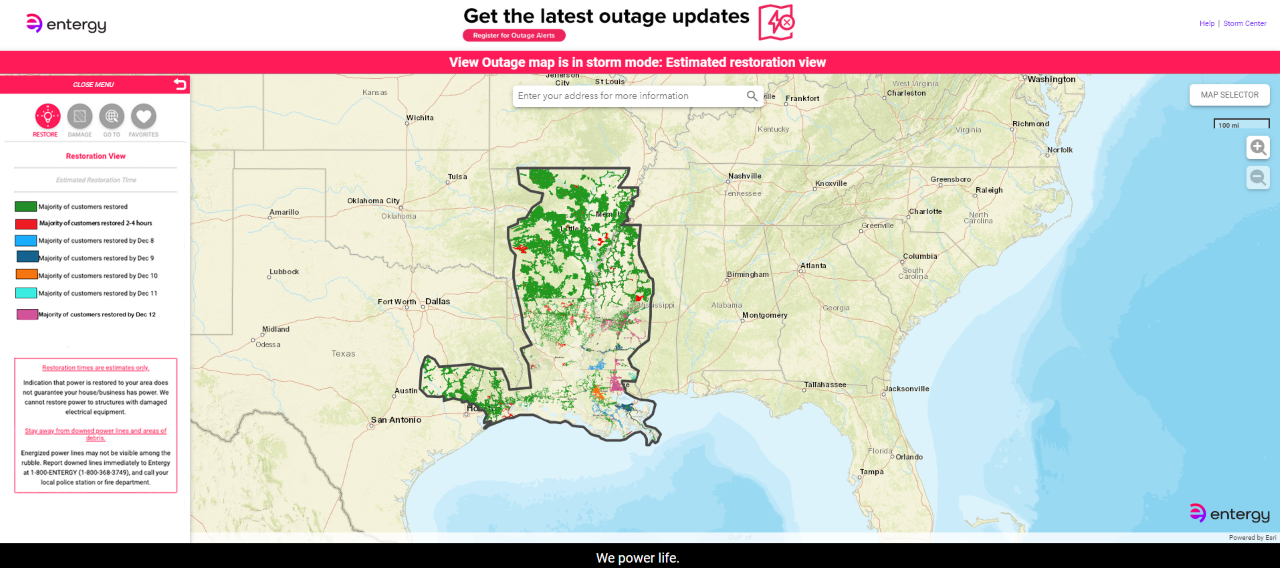
Estimated restoration times are shared at the feeder-level, which are circuits that run through neighborhoods.
The map may look similar for several days following landfall. When estimated restoration timelines are available, you’ll see this reflected as colored lines displayed on the restoration map view.
Download the free Entergy mobile app
Call 1-800-9OUTAGE (1-800-968-8243) to report downed power lines